Make a line plot
plot_line_thl.RdMake a line plot
plot_line_thl(
  data,
  xvar,
  yvar,
  groupvar = NULL,
  linewidth = 3,
  colors = palette_thl("line"),
  lang = "fi",
  plot.missing = FALSE,
  linetype.missing = 2,
  marked.treshold = 10,
  breaks.x = waiver(),
  breaks.y = waiver_thl(),
  y.limits = c(0, NA),
  panels = FALSE,
  nrow.panels = 1,
  labels.end = FALSE
)
Arguments
- data
a data frame
- xvar
variable to be plotted on the x-axis.
- yvar
variable to be plotted on the y-axis.
- groupvar
grouping variable. Defaults to NULL (no grouping).
- linewidth
width of the line in PostScript points, defaults to 3.
- colors
Colors to be used. Defaults to THL qualitative color palette for line plots. (see
palette_thl).- lang
language options for the y-axis labels. Defines the style of big marks and decimal marks (see
format_thl)- plot.missing
TRUE/FALSE, should the missing values be linearly interpolated and plotted with dotted line. (see
thlNaLinesfor more details)- linetype.missing
linetype for missing observations
- marked.treshold
The maximum amount of data points plotted. A dot (default 10). If the number of data points is greater than this treshold, dots are plotted only at the beginning and the end of the line. Setting this to NULL will omit all dots.
- breaks.x
A character vector defining the x-axis breaks.
- breaks.y
A character vector defining the y-axis breaks.
- y.limits
limits for the y-axis
- panels
Should multiple graphs be plotted in separate panels? If TRUE, the panels are based on the grouping variable defined by the
groupvar-argument.- nrow.panels
In how many rows should the panels be plotted?
- labels.end
Whether the line labels should be displayed at the right end of each line instead of legend.
Value
A ggplot -object.
Examples
year <- 1999:2017
set.seed(1234)
value1 <- jitter(c(250:(250+length(year)-1)), factor = 100)*1000
value2 <- jitter(c(200:(200-length(year)+1)), factor = 300)*1000
value3 <- jitter(c(100:(100-length(year)+1)), factor = 400)*1000
dat <- data.frame(year = rep(year,3), value = c(value1, value2, value3),
group = factor(rep(c("Rabbits", "Magicians", "Playing cards"),
each = length(year))))
dat$value <- with(dat, ifelse(year %in% c(2012,2013) & group == "Rabbits", NA, value))
dat$value <- with(dat, ifelse(year == 2007 & group == "Magicians", NA, value))
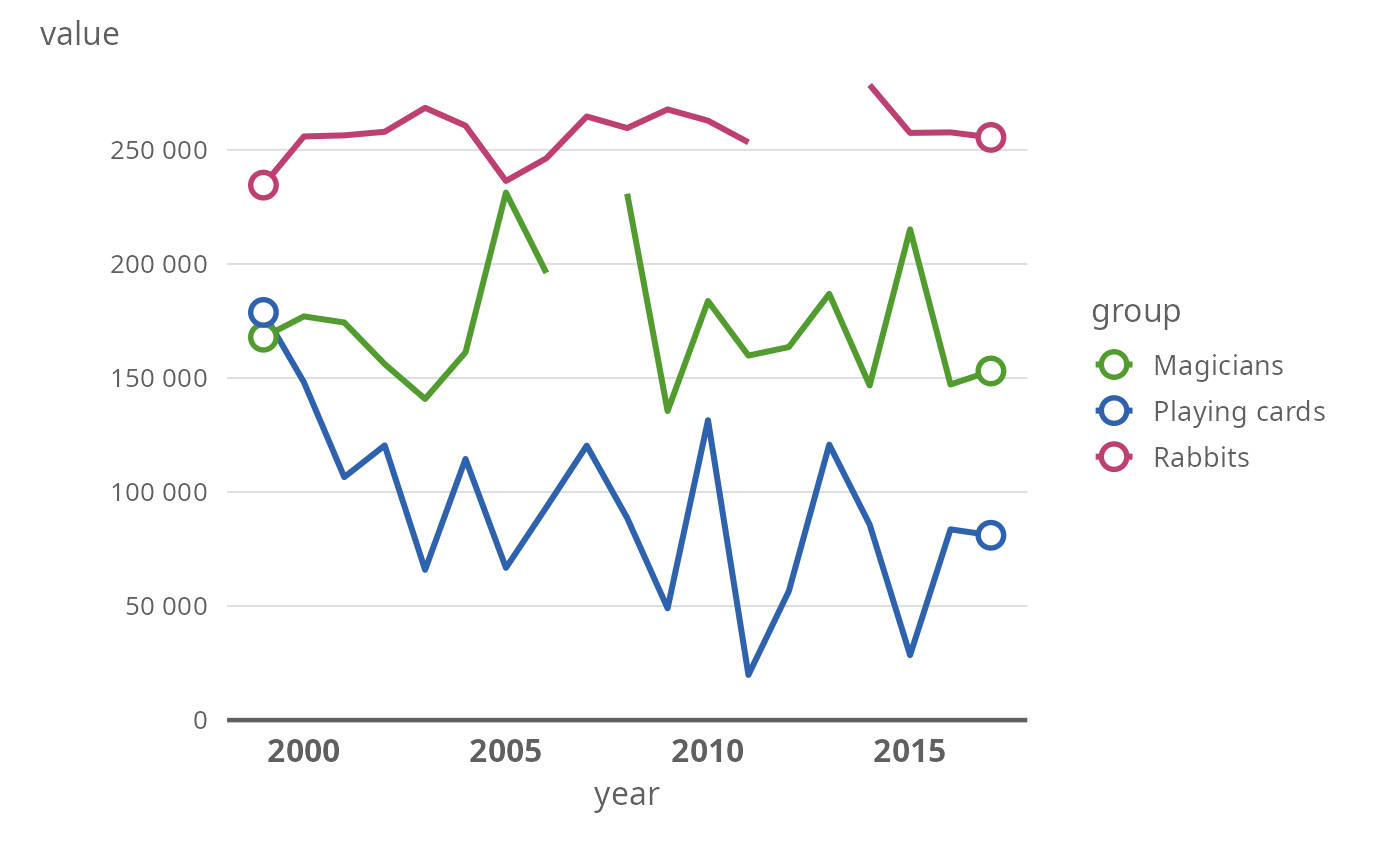
plot_line_thl(data = dat, xvar = "year", yvar = "value", groupvar = "group")
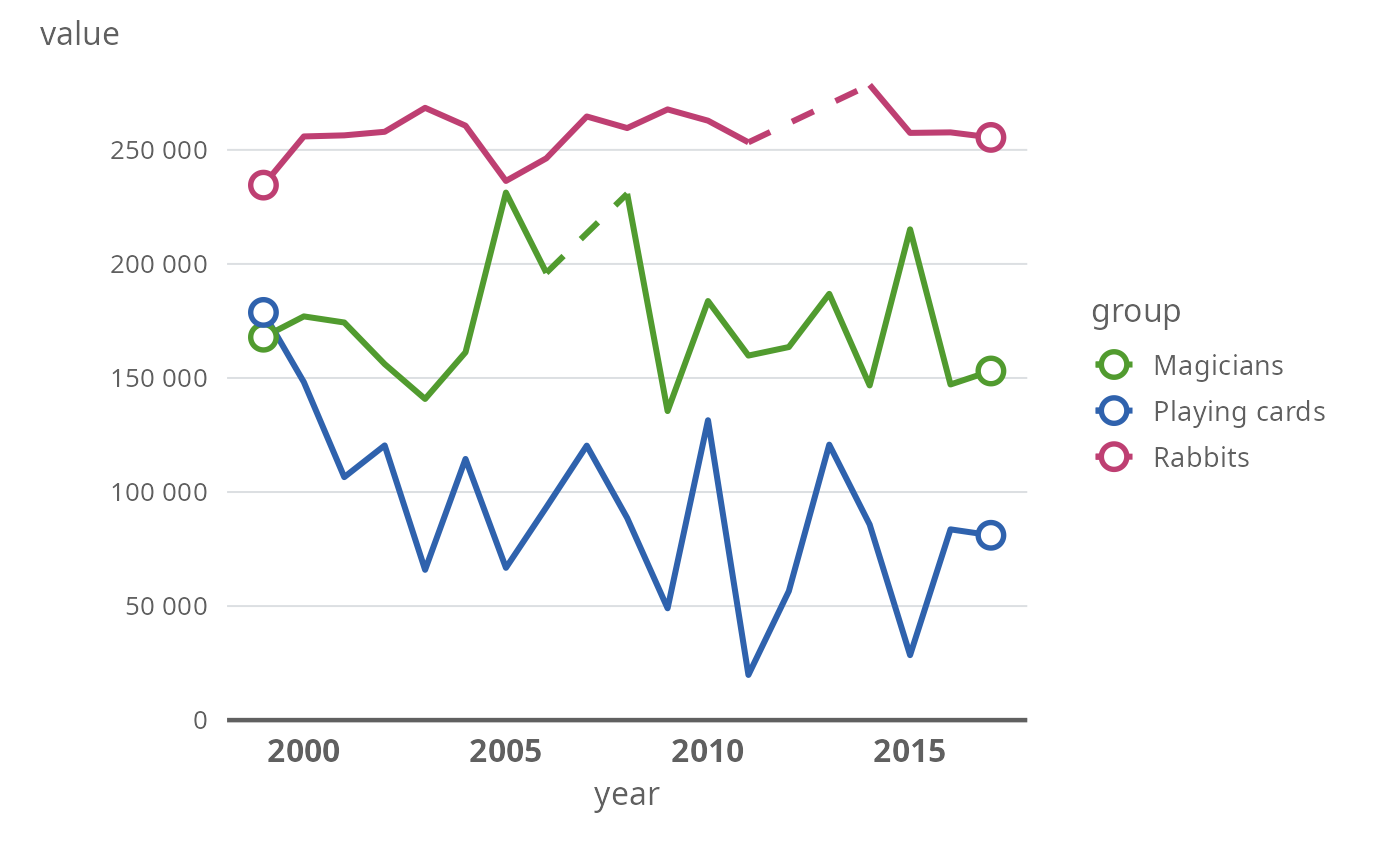
 plot_line_thl(data = dat, xvar = "year", yvar = "value", groupvar = "group",
plot.missing = TRUE)
plot_line_thl(data = dat, xvar = "year", yvar = "value", groupvar = "group",
plot.missing = TRUE)
 plot_line_thl(data = dat, xvar = "year", yvar = "value", groupvar = "group",
labels.end = TRUE) +
labs(title = "Random numbers from the hat!",
caption = "(c) Magician",
subtitle = "Maybe not totally random?",
y = "#N", x = "Year")
plot_line_thl(data = dat, xvar = "year", yvar = "value", groupvar = "group",
labels.end = TRUE) +
labs(title = "Random numbers from the hat!",
caption = "(c) Magician",
subtitle = "Maybe not totally random?",
y = "#N", x = "Year")
